Şansın adil testlerde oynayabileceği rolün değerlendirilmesi

Şansın rolü, adil tedavi kıyaslamalarının yorumlanmasında bizi iki çeşit hata yapmaya itebilir: tedavi sonuçlarında olmamasına rağmen gerçek farklılıklar olduğu sonucuna varabilir ya da var olan farklılıkların olmadığı sonucuna varabiliriz. Gözlemlenen tedavi sonuçları ne kadar fazlaysa, bu şekilde yanılma ihtimalimiz o kadar azalacaktır.
Çünkü tedavi kıyaslamaları, tedavi edilebilen duruma sahip olan/olacak herkesi kapsamaz, tedaviler arasındaki “gerçek farklılıkları” mutlak surette bulmak mümkün olmayacaktır. Bunun yerine, çalışmalar gerçek farklılıkların neler olabileceğine dair en iyi tahminleri üretmek zorundadır.
Tahmini farklılıkların güvenilirliği, genellikle “Güven Aralıkları” (GA) ile gösterilir. Bu aralıklar, gerçek farklılıkların hangi aralıkta yayılabileceğini gösterir. Pek çok kişi, bu isimle olmasa bile güven aralıkları kavramına zaten aşinadır.

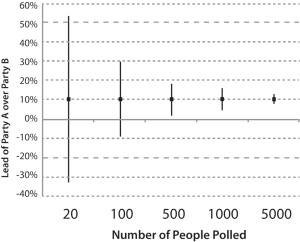
Örneğin, seçimlerden hemen önceki bir fikir anketi A Partisinin B Partisinin yüzde 10 puan ilerisinde olduğunu belirtebilir ancak bu rapor daha sonra genellikle gruplar arasındaki farkın 5 puan kadar az ya da 15 puan kadar çok olduğunu da belirtecektir. Bu “güven aralığı” gruplar arasındaki gerçek farkın yüzde 5 ila 15 puan arasında bir yerlerde dağılım gösterdiğini belirtir.

Ankete katılan kişi sayısı ne kadar çoksa, sonuçlarla ilgili belirsizlik o kadar az olacaktır; bu yüzden fark tahmini ile ilgili güven aralığı da o kadar dar olacaktır.

İki siyasi partiyi destekleyen seçmenlerin oranlarındaki tahmini farkın belirsizlik değeri ölçülebileceği gibi, iki tedavi sonrasında iyileşen veya kötüleşen hastaların oranlarındaki tahmini farklılığa ilişkin belirsizlik derecesi de ölçülebilir.

Yine bu noktada, gözlemlenen tedavi sonuçları ne kadar fazlaysa, örneğin kalp krizi sonrası iyileşme gibi,  iki tedavi arasındaki kıyaslamada, tedavi farklılıklarının tahminleriyle ilgili güven aralıkları o kadar dar olacaktır. Güven aralıklarıyla ilgili olarak “ne kadar darsa, o kadar iyidir” denebilir.

Bir güven aralığı genellikle, doğru değerin sunulan tahmin aralığında bulunacağından ne kadar emin olduğumuzun bir göstergesidir. Örneğin, “%95’lik güven aralığı”, tahmin edilen doğru değerin güven aralığında bulunmasından %95 emin olduğumuz anlamına gelir. Yani aslında “doğru” değerin aralık dışında kalma şansı 100’de 5 ihtimaldir (%5).


The 95% Confidence Interval (CI) for the difference between Party A and Party B narrows as the number of people polled increases.

The 95% Confidence Interval (CI) for the difference between Party A and Party B narrows as the number of people polled increases (click to enlarge).


Print Friendly
  • Steve George

    Overall this is a superb book and website. However, the stated meaning of ‘confidence interval’ is not correct. Maybe this is an intentional simplification because the book and website are intended for a broad audience. However, it makes one suspicious about other claims made by the authors if one of the important aspects is wrong. The correct meaning of a 95% confidence interval is that 95 out of 100 confidence intervals obtained in the same way (same population and same sample size) will include the true mean. To say that there’s a 95% chance that the true mean lies within the confidence interval would mean that there many different true means, and 95 out of 100 of them fall within this particular confidence interval. Of course there is only one true mean, and it will lie within 95 out of 100 similarly-obtained confidence intervals.

    • Anonymous

      Many thanks for your kind words Steve, and I am sure that the team will want to make sure that everything is as accurate as it can be.

      You are right, in that the intention is to explain confidence intervals for an informed lay reader. I know from experience that this is not easy, and that sometimes an approximation is easier to understand.

      Stay tuned and I will see what they say.

    • Paul Glasziou

      Thanks for your complimentary remarks about the book. We might have used a different approach in our effort to explain confidence intervals, and we discussed this when writing the section. The deliberate simplification we used reflected our experience of trying to explain the precise frequentist interpretation of confidence intervals to lay audiences: this approach either seems to confuse them or goes over their heads. We could also have used Credible Interval and a uniform prior to match our more Bayesian explanation (http://en.wikipedia.org/wiki/Credible_interval), but that is not the term people are likely to come across.
      We are currently searching systematically for formal comparisons of the extent to which among alternative wording to explain research methods most helps lay people to get the right end of the stick. This is one of several issues that we would like to see addressed empirically to improve the evidence base needed to support better understanding of health research. Please let us know if you would like to be involved, and we would also encourage you and readers to become involved in http://www.nsuhr.net – An international Network to Support Understanding of Health Research.

  • Robert42

    Confidence intervals represent the uncertainty of an estimate attributable to sampling error. Small sample, bigger error, broader confidence interval. Big sample, smaller error, narrower confidence interval. If the sample encompasses all of the sample frame the uncertainty falls to zero and the confidence intervals disappear.

    A 95% confidence interval means that if we were to repeat our test 100 times, the calculated confidence intervals would encompass the mean arrived at through full and complete coverage of the sample frame roughly 95 times. This mean is not a ‘true’ value. Confidence intervals only represent the uncertainty from sampling. There will be other errors in the measurement system that will forever keep us from knowing the ‘truth’. This is why Deming insists that there is no truth in measurement and the idea there is, is so destructive to understanding statistical analysis.

    To conclude say, a difference between a treatment and control group is statistically significant at the 95% level, only means our experiment would come to similar estimates 95% of the time. It doesn’t mean the difference is real or true. (After all, we already knew the two groups were different.) All manners of statistical significance are comments on the measurement system used, not the reality being measured.